Vibrant SCADA is on-premise supervisory software we developed ourselves. It sits on a PC or edge box inside your plant, reads your PLCs directly over the plant network, and keeps its own history, alarms and screens — with no internet connection.
Every plant we work in has the same three problems with supervisory software: it is priced per tag, it assumes an internet route the switchroom does not have, and the historian belongs to somebody else. Vibrant SCADA was written to remove all three.
One Windows service or one container on a plant PC, industrial box or edge device. No database server to install, tune and back up. No outbound internet route required at any point.
Recent data in a local database, older data in open Parquet files that Excel, Power BI, Python or DuckDB read directly. Backing the system up is copying one folder.
A signed licence file bound to your machine, with a perpetual option. If maintenance lapses you keep running the version you have. A live operator screen is never blacked out because a date passed.
Siemens S7-300, S7-400, S7-1200 and S7-1500 over ISO-on-TCP; Modbus TCP and Modbus RTU for energy meters, VFDs and RS-485 multi-drop buses; OPC UA for third-party equipment. Mixed protocols in one project.
Every tag carries its own scan class from 100 ms to one minute. Tags are never read one at a time — addresses are merged into contiguous block reads sized to the CPU’s PDU, which is what makes a 250 ms screen possible at all.
Sampling rate and archiving rate are separate, per tag. A tag read at 250 ms can be archived once a minute, or only when it moves beyond a deadband — the difference between a few hundred rows a day and a few hundred thousand.
High, High-High, Low, Low-Low, digital, rate-of-change, deviation, quality and communication rules, plus custom expressions. Alarms are raised and logged whether or not a screen is open, and one acknowledgement covers every workstation.
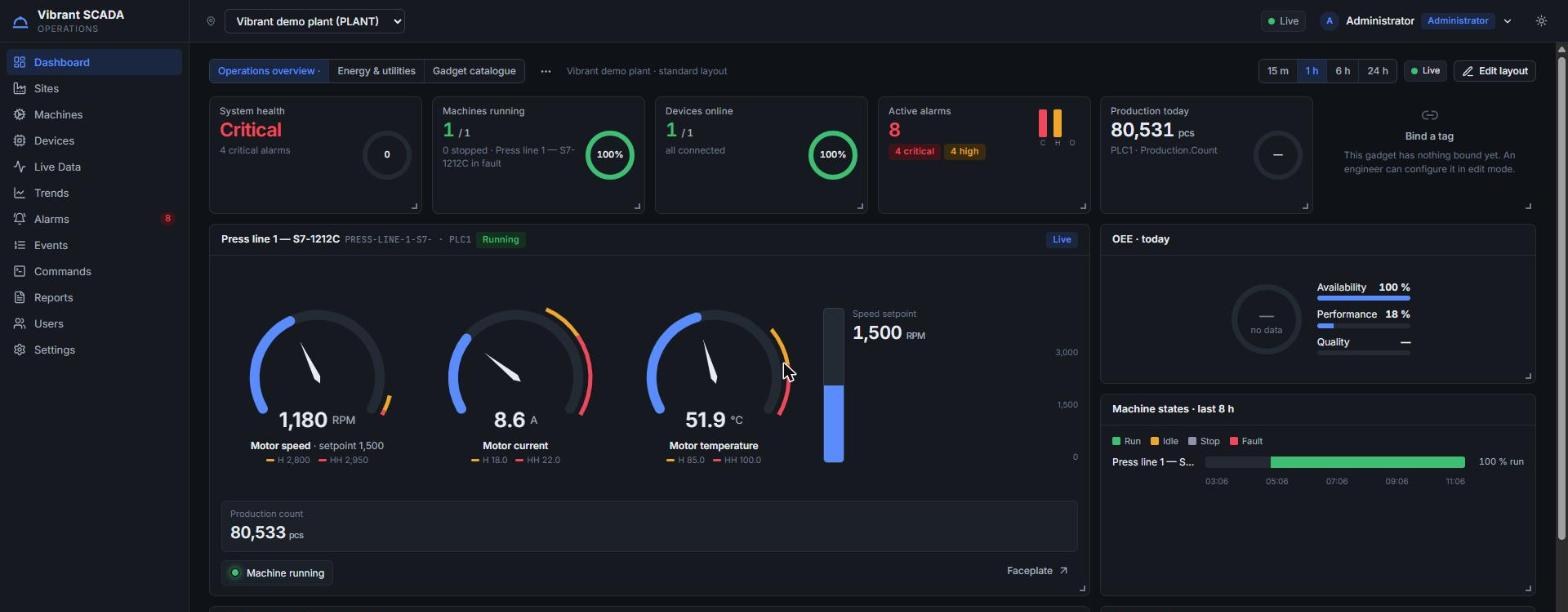
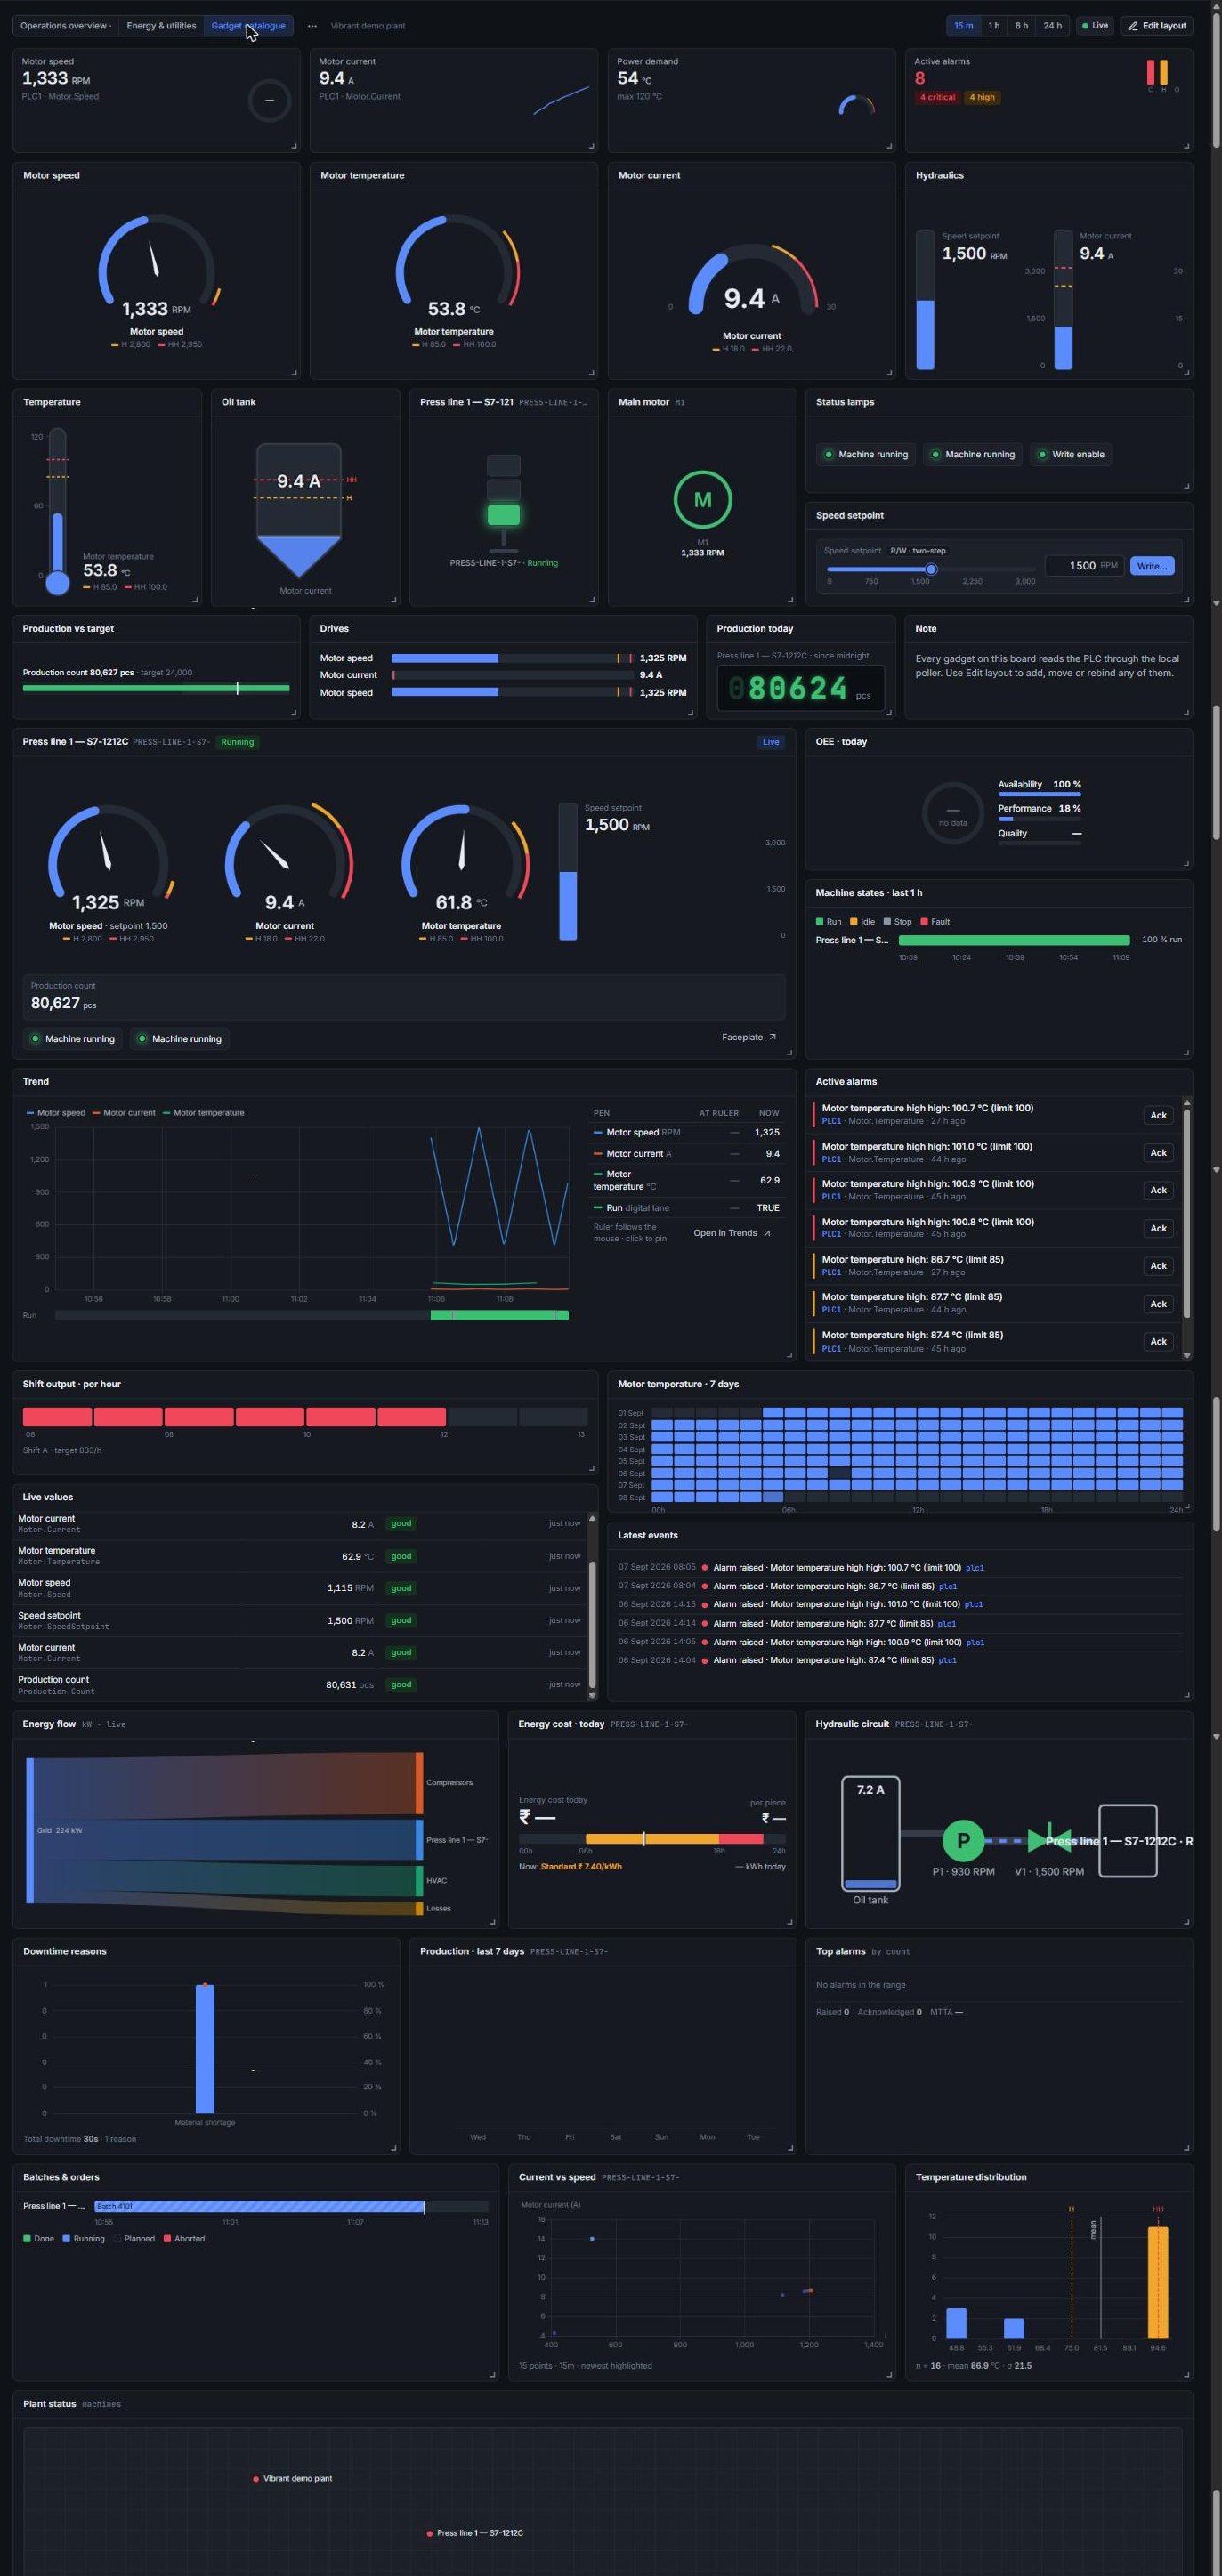
A drag-and-drop board editor with gauges, bar and thermometer indicators, tanks, motors, status lamps, trends, energy flow and alarm strips — plus a mimic canvas for drawing tanks, pumps, valves and connecting pipes by hand.
Setpoint and command writes follow a two-step confirmation and are recorded in an audit log. Success means the device acknowledged the write — not that a timer expired. Local accounts with viewer, operator, engineer and administrator roles.
Every gadget below is reading a live S7-1212C through the local poller. Boards are assembled by dragging gadgets onto a grid and binding each one to a tag — no scripting, and no separate runtime licence per screen.
These are measured figures on an ordinary plant PC with an SSD, not a marketing ceiling. Before we commit to a scan rate on your site we run a diagnostic against your actual CPU and report the measured cycle time per scan class.
Comfortable on a single CPU — the range most machine and line screens live in.
Typical for a plant-wide supervisory board across several devices.
Large installations, energy metering and multi-PLC sites.
If a scan class overruns its period the poller logs it and skips, so one unresponsive CPU cannot build an unbounded backlog.
Symbolic DB names map to numbers, so renumbering a block in TIA is a single edit. A wrong address is rejected at start-up with the reason, and every other tag keeps reading.
Quality travels with every value, so a trend shows a genuine gap where a CPU was unreachable instead of a flat line that looks like real data.
Long-term data is written as open Parquet day files, so an audit can be answered with tools the customer already owns — no export licence and no vendor in the middle.
Notifications reach e-mail directly and WhatsApp, Teams or Slack through a webhook, with per-recipient throttling and quiet hours. Critical alarms always go through.
Authentication is local to the plant. Nothing about the system depends on an external identity provider or an internet route.
Installed as a Windows service it starts before login and survives a reboot. Operators reach it from any browser on the plant network — nothing to install on their machines.
Modbus energy meters read directly, kWh totalled by line, asset and shift, and a customised report mailed automatically every morning. This is the fastest payback we see, because the waste it exposes is usually idle running.
Where an HMI panel shows one machine and nothing keeps the history, a plant PC screen gives the shift a live overview, a trend and an alarm list — without a full DCS project.
When we retrofit an S7-200 or S7-300 to S7-1200 or S7-1500, the supervisory layer is often the missing half. Vibrant SCADA gives the new CPU screens and a historian from day one.
Readings written into a register by hand every hour become an automatic archive with real timestamps, min/max and quality — the difference between a log and evidence.
Panel lamps only help someone standing in front of them. Rules evaluated in the server reach e-mail, WhatsApp or Teams with the tag, the value and the limit that was crossed.
OPC UA and Modbus bring packaged machines, compressors, chillers and metering into the same screen as your Siemens line, without waiting on the OEM.
We connect to one CPU, read every tag you want on screen and measure the real cycle time per scan class. You get the measured numbers whether or not you go ahead.
One PLC, one screen, one alarm set, running on a plant PC. Enough to prove the acquisition rate and let operators use it for a few weeks before anything is signed.
More devices, mimics drawn for the process, alarm rules agreed with maintenance, the historian sized for your retention policy, notifications wired to the people who should get them.
Installed as a service, documented, with your engineers trained to add tags and edit boards themselves. Our Siemens-certified engineers stay available for the PLC side.
No. It runs entirely on a computer inside your plant. Acquisition, the historian, the alarm engine and every screen work on the local network with no outbound route, which is how most process plants are required to operate.
Siemens S7-300, S7-400, S7-1200 and S7-1500 over ISO-on-TCP, any Modbus TCP or Modbus RTU device such as energy meters and VFDs, and any OPC UA server for third-party equipment. Several protocols can run in the same project.
On an ordinary plant PC: roughly 200 to 400 tags at a 250 ms scan, 800 tags at 500 ms, or 2,000 tags at 1 second. We measure your actual CPU before committing to a scan rate rather than quoting a number blind.
No, and that is deliberate. Control stays in the PLC. Vibrant SCADA supervises, records and alarms; it never closes a control loop. Operator setpoint writes go through a confirmed, audited command sequence.
It stays in one folder on your machine. Recent history is in a local SQLite database and older data in open Parquet files that Excel, Power BI, Python or DuckDB can read directly. Backing the system up means copying that folder.
A signed licence file tied to your machine, with a perpetual option. If a licence lapses the software keeps running the version you have and never blacks out a live operator screen.
Send us a tag list, or just the CPU model, and we will tell you what a Vibrant SCADA pilot on that line would look like — scan rate, tag count and cost — before you commit to anything.